Archive for the ‘many eyes’ Category
Data Visualization Talks Online
Lately, I have been collecting links to videos of talks related to Data Visualization. I found multiple talks for some people and so have categorized them accordingly. I have also tried to provide some context to the individual/group.
I think the first TED talk by Hans Rosling (@hansrosling) got a lot of media attention and made people sit up and appreciate the power of ‘narrative visualization’. He almost make it look like a sport with him serving as the role of a commentator. The title on TED’s website for the talk is “the best stats you’ve ever seen“. I am not sure about that, but it is a very entertaining talk.
It was followed up by an interesting study by information visualization researchers George Robertson, Roland Fernandez, Danyel Fisher, Bongshin Lee and John Stasko in the Infovis 2008 paper titled “Effectiveness of Animation in Trend Visualization.” Here is an interesting excerpt from the abstract of the paper:
Results indicate that trend animation can be challenging to use even for presentations; while it is the fastest technique for presentation and participants find it enjoyable and exciting, it does lead to many participant errors. Animation is the least effective form for analysis; both static depictions of trends are significantly faster than animation, and the small multiples display is more accurate.
Hans Rosling was back again at TED 2007 with “New Insights on poverty” and has spoken many times since at TED.
Fernanda Viégas and Martin Wattenberg (@wattenberg) (previously at IBM Research) have brought visualization to the masses in through IBM Many Eyes. They have recently started a new venture called FlowingMedia. Here are some links to their talks:
- TEDxSP 2009 – Fernanda Viégas (in Portuguese with english subtitles)
- Stanford CS Department – Democratizing Visualization (wmv)
Manuel Lima (@mslima) of visualcomplexity.com gave an interesting talk at Made by Many. His talk titled Network Visualization in an Age of Interconnectedness was not only an excellent talk, but ended up starting quite a passionate debate which led to Manuel writing a post titled Information Visualization Manifesto. I urge you to read the post and look at the interesting perspectives that infovis experts in the field had to Manuel’s manifesto. Manuel gave another interesting talk at the Creativity and Technology (CaT) 2009: Information Visualization.
Aaron Koblin (@aaronkoblin) has been involved with creating innovative and evocative data visualization pieces such as the New York Talk Exchange, Radiohead’s House of Cards music video (You can see Aaron in the “Making of House of Cards” video), the very entertaining ‘Bicycle built for 2000‘ project and many others.
Making of House of Cards
Links to a couple of Aaron’s talks are below:
- Visualizar 09 – Data Visualization and Art
- CaT 2009 – The Wizard of Data Art, Aaron Koblin
Tom Wujec is a fellow at Autodesk. His talk on 3 ways the brain creates meaning provides an amazing insight into our brain. He addresses issues related to why data visualization works and how the brain visualizes data.
Jeff Heer has developed information visualization tools that can be used by developers around the world for creating interactive visualizations of their own data. He is the authors of Prefuse, Flare (Check out the excellent demos) and most recently, Protovis (many great examples online). Lately, he has published an informative articles in the ACM Queue titled A tour through the visualization zoo – Jeffrey Heer, Michael Bostock, Vadim Ogievetsky. He does a great job interviewing Fernanda Viegas and Martin Wattenberg in the ACM Queue. A talk by him at the Stanford HCI seminar can be found here (html link, wmv).
Alex Lundry (@alexlundry) presents a very interesting point of view in his talk – “How visualization changes everything“.
Nicholas Christakis presents a very fascinating talk where he used social data visualization to explore the influence of social networks – “The hidden influence of social networks.” In his talk he says that spreading of obesity is due to your social network. Smoking and even divorce can be linked to the company you keep.
Sebastian Wernicke presents a light hearted look where he analyzes TED talks and presents some statistics based on the analysis in his talk – Lies, damned lies and statistics (about TEDTalks)
Please let me know if I have missed any interesting data visualization talks that are available online and I will be happy to update the post.
Interactive visualization at your fingertips
 With today’s release of Tableau Public, Tableau Software has opened up infinite possibilites for researchers, corporations and enthusiasts alike to interact, explore and play with their data. More importantly, with Tableau Public one can now have ‘interactive’ visualizations online as opposed to static images. This is a step in the right direction for Data Visualization software, since increasingly one hears from domain experts who want to ‘use’ software and not have to write programs (however small or easy those programs may seem to the developer of the software). Tableau now allows researchers to explore their data and collaborate more effectively instead of having to share static ‘screenshots’ via email.
Such uses of visualization software have already been explored and shown to be hugely successful by the ManyEyes team in their CHI ’08 paper, but the capabilities and strengths of both the products are in somewhat disjoint areas. For example, Tableau focuses on the Business Intelligence community and lacks certain visualizations such as Treemaps or Text visualizations (which ManyEyes seem to do really well). Other interesting and inspiring uses of Tableau Public can be found in their Gallery at http://www.tableausoftware.com/public/gallery. Dont forget to check out the NYC Graffiti workbook that they have online. Detailed training videos can be found at http://www.tableausoftware.com/public/training
ManyEyes – Reader  s of this blog already know my fondness for IBM’s Many Eyes. ManyEyes has been a pioneer in this field of online visualization software that facilitates data visualization without the need for programming. Research papers from the Many Eyes team detailing user interactions and unexpected uses of the visualization software can be found at http://bewitched.com/manyeyes.html
Verifiable is another  such website that allows online visualization of data. So far the data visualizations that are possible are limited to bar charts, scatter plots and line charts but the trend is definitely promising and I hope they continue to improve the excellent service. A video can be found online at http://verifiable.com/screencast
Swivel is similar to  Verifiable, where one can upload data and create online interactive visualizations. Videos for all the features in Swivel can be found at http://www.swivel.com/features. Unfortunately, they have a 15-day free trial that restricts the widespread use of their tools.
As I interact with experts and students from domains as wide as political sciences, biology, economics and so on, I am pleased to hear the awareness that they have for effective visualization but I am sometimes disheartened to have to tell them to learn programming to learn some of our nifty tools. Tableau Public, IBM Many Eyes and others are exceptional in the service that they provide. I envision more research groups, corporate websites and so on posting interactive visualizations with a ‘Powered by Tableau’ icon or something similar in the bottom right corner.
Seminal information visualization papers
Here is an article that I wrote at Vizworld.com. Vizworld.com is a great resource for all things related to graphics and visualization and is one of the websites that I regularly visit to keep updated with the field. This article has been updated with resources that some of the visitors mentioned in the comments section and I thank them for the same.
I have been thinking about making a list of some of the most seminal information visualization papers. These are papers that have made an impact and can be widely seen in the media (print/web) or are being adopted in visualization software/systems such as VTK, Prefuse, Many Eyes and so on. I may have missed out on a few papers, so please feel free to add any that you think are ‘must-reads’ for an infovis researcher.
Disclaimer: The list in no particular order of preference.
Here’s the list:
- Cluster and Calendar based Visualization of Time Series Data, Jarke J. van Wijk and Edward R. van Selow, Proc InfoVis 99, p 4-9.

- Polaris: A System for Query, Analysis and Visualization of Multi-dimensional Relational Databases, Chris Stolte, Diane Tang and Pat Hanrahan, IEEE Transactions on Visualization and Computer Graphics, Vol. 8, No. 1, January 2002.
- The Eyes Have It: A Task by Data Type Taxonomy for Information Visualizations, Ben Shneiderman, Proc. 1996 IEEE Visual Languages. An interesting sentence from the paper – “Information exploration is inherently a process with many steps, so keeping the history of actions and allowing users to retrace their steps is important. However, most prototypes fail to deal with this requirement.” I feel that with the amazing ‘provenance’ based work that Claudio Silva’s group at the University of Utah are doing on Vistrails, some of this is being finally addressed.
- How Not to Lie with Visualization, Bernice E. Rogowitz and Lloyd A. Treinish, Computers In Physics 10(3) May/June 1996, pp 268-273.
- Excentric Labeling: Dynamic Neighborhood Labeling for Data Visualization. Jean-Daniel Fekete and Catherine Plaisant. Proc. CHI’99, pages 512-519. There is a new paper this year at EuroVis 2009 that extends the techniques proposed in this paper – Extended Excentric Labeling by Enrico Bertini, Maurizio Rigamonti and Denis Lalanne.
- VisDB: Database Exploration using Multidimensional Visualization, Daniel A. Keim and Hans-Peter Kriegel, IEEE CG&A, 1994
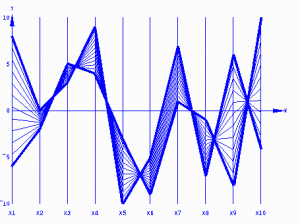
- Parallel Coordinates: A Tool for Visualizing Multi-Dimensional Geometry. Alfred Inselberg and Bernard Dimsdale, IEEE Visualization ‘90, 1990.
- Smooth and Efficient Zooming and Panning. Jack J. van Wijk and Wim A.A. Nuij, Proc. InfoVis 2003, p. 15-22
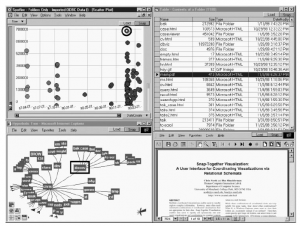
- Snap-Together Visualization: Can Users Construct and Operate Coordinated Views? Chris North, B. Shneiderman. Intl. Journal of Human-Computer Studies, Academic Press, 53(5), pg. 715-739, (November 2000)
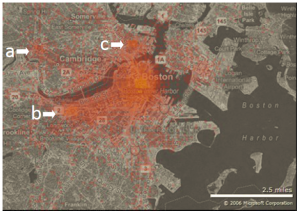
- Hotmap: Looking at Geographic Attention Danyel Fisher, IEEE TVCG 13(6):1184-1191 (Proc. InfoVis 2007).
- Tree visualization with treemaps: a 2-d space-filling approach, Ben Shneiderman, ACM Transactions on Graphics, vol. 11, 1 (Jan. 1992) 92-99 and B. Johnson and B. Shneiderman, “Tree-maps: A Space Filling Approach to the Visualization of Hierarchical Information Structures“, Proc. of Vis ‘91, Oct. 1991, pp. 284-291.
- Danny Holten (2006), Hierarchical Edge Bundles: Visualization of Adjacency Relations in Hierarchical Data, IEEE Transactions on Visualization and Computer Graphics, vol. 12, no 5, pp. 741-748. – This has already been implemented in VTK and is very useful for visualizing hierachical data.
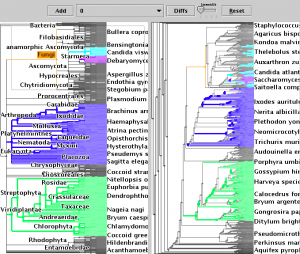
- Tamara Munzner, Francois Guimbretiere, Serdar Tasiran, Li Zhang, and Yunhong Zhou (2003), TreeJuxtaposer: Scalable Tree Comparison using Focus+Context with Guaranteed Visibility, SIGGRAPH 2003 , published as ACM Transactions on Graphics 22(3), pp. 453-462.
- M. Stone, “Choosing Colors for Data Visualization“, 2006.
- Penny Rheingans (1999). Task-based Color Scale Design. Proceedings of Applied Image and Pattern Recognition ‘99, SPIE, pp. 35-43.
- F. Viegas, M. Wattenberg, F. van Ham, J. Kriss, and M. McKeon, “ManyEyes: A Site for Visualization at Internet Scale“, IEEE Trans. on Visualization and Computer Graphics, Vol. 13, No. 6, Nov.-Dec. 2007, pp. 1121-1128.
- J. Heer, S. Card, J. Landay, “prefuse: a toolkit for interactive information visualization“, Proceedings of ACM CHI ‘05, April 2005, pp. 421-430.

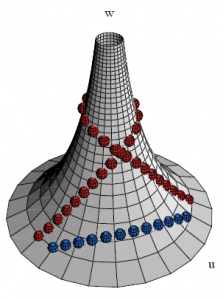
- John Lamping , Ramana Rao , Peter Pirolli, A focus+context technique based on hyperbolic geometry for visualizing large hierarchies, Proceedings of the SIGCHI conference on Human factors in computing systems, p.401-408, May 07-11, 1995, Denver, Colorado, United States
- S. Havre, B. Hetzler, and L. Nowell, “ThemeRiver: Visualizing Theme Changes over Time”, Proceedings of the 2000 IEEE Information Visualization Symposium, Salt Lake City, Oct. 2000, pp. 115-123. Image from Theme river inspired work – Stacked Graphs: Geometry & Aesthetics, Lee Byron, Martin Wattenberg, IEEE InfoVis 2008
- M. Wattenberg and J. Kriss, “Designing for Social Data Analysis,” IEEE Transactions on Visualization and Computer Graphics Vol. 12, No. 4, Jul.-Aug. 2006, pp. 549-557.
Other than these papers, these books are a source of invaluable advice about visualizing data.
Books
- Tufte, Edward R. (2001). The Visual Display of Quantitative Information (2nd ed.). Cheshire, CT: Graphics Press. ISBN 0961392142.
- Tufte, Edward R. (1990). Envisioning Information. Cheshire, CT: Graphics Press. ISBN 0961392118.
- Tufte, Edward R. (1997). Visual Explanations: Images and Quantities, Evidence and Narrative. Cheshire, CT: Graphics Press. ISBN 0961392126.
- Few, Stephen (2004). Show Me the Numbers: Designing Tables and Graphs to Enlighten. Analytics Press. ISBN 978-0970601995.
- Few, Stephen (2006). Information Dashboard Design: The Effective Visual Communication of Data. O’Reilly Media. ISBN 978-0596100162.
- Few, Stephen (2009). Now You See It: Simple Visualization Techniques for Quantitative Analysis. Analytics Press. ISBN 978-0970601988.
- Ware, C. (2004) Information Visualization: Perception for Design. (2nd Edition) Morgan Kaufman. December, 435 pages.
- Ware, C. (2008) Visual Thinking for Design. Morgan Kaufman
- Casey Reas and Ben Fry (2007), Processing: A Programming Handbook for Visual Designers and Artists. MIT Press. 736 pages.
- Ben Fry (2007), Visualizing Data, O’Reilly. 384 pages.
- William S. Cleveland (1985). The Elements of Graphing Data, Hobart Press.
- William S. Cleveland (1993). Visualizing Data, Hobart Press.
What other papers/books would you add to this list?
Visualizing the economy and its effects
Other than the standard line/bar charts that you will see showing the state of the economy as measured by some index, here are some interesting ways in which the economy and its impact is being conveyed.
- TipStrategies.com have an amazing visualization of the jobs gained dropping around May 2007 and the job losses really picking up in late 2008. Click here to see the entire video progression http://tipstrategies.com/archive/geography-of-jobs/
- Interactive map of job’s per county on Slate.com. You can interact with the map at http://www.slate.com/id/2216238/. Here are two snapshots contrasting the situation from January 2007 with that in March 2009. The entire east coast, major cities in California, Washington, Oregon and the midwest seem to be most affected with job losses.


- Flowingdata as always has an excellent post on job losses. This snapshot compares the current recession with recessions in the past and job losses in that recession.

- There is actually a blog titled Visualizing Economics – http://www.visualizingeconomics.com/. One of my favorite posts on this blog is on the relationship between your occupation and the your income. You can download the original pdf or even buy the original poster at http://www.visualizingeconomics.com/posters. Apparently, podiatrists make just a little less than an average chief executive 🙂 . Here’s a snapshot

- The Associated Press had a news story where they created a ‘stress map’. The story can be found at http://news.yahoo.com/s/ap/20090518/ap_on_re_us/us_stress_map.You can clearly pinpoint certain regions, but mostly parts of the west coast seems to be affected the most as per their three economic variables – unemployment, foreclosures and bankruptcy. An interactive visualization can be found at http://hosted.ap.org/dynamic/files/specials/interactives/_national/stress_index/index.html?SITE=YAHOO&SECTION=HOME. Here’s a snapshot of the stress map

- FlowingData.com had yet another great post showing a visual representation of the seven deadly sins. Interestingly, Wall Street shows up pretty high on the ‘Greed’ visual representation whereas the Wrath can be seen most in the southern and south eastern parts. Looking at Slate’s job losses map above, one could say that job losses are loosely corrleated with anger and ‘wrath’ in certain regions. Las Vegas Sun ran a story on the study and the related visualizations which can be found at http://www.lasvegassun.com/news/2009/mar/26/one-nation-seven-sins/
- GOOD Magazine – has an amazing infographic in a post on the economy. Here’s a lower resolution snapshot of the original. A higher resolution image can be found at http://awesome.goodmagazine.com/goodsheet/goodsheet006economy.html

- Investment companies are now making charts to help consumers and clients – Here’s a really nice infographic from Russell Investments
- Users at Many Eyes have been busy visualizing any data that they can get their hands on as regards to the economy
- Visualizing President Obama’s speech on the economy – http://manyeyes.alphaworks.ibm.com/manyeyes/visualizations/obamas-speech-on-economy-october-200
- Visualizing Economy and Presidential Administrations – Wonder what President Obama’s data will look like. Here’s a snapshot of the interactive visualization

- For those still investing ;), there’s always SmartMoney’s Treemap-based visualization of the Market situation updated in realtime

- Static Visualization of the Dow Jones Industrial Average Index – http://www.mamk.net/?p=1644
- What do people think about the situation right now. Twitter feeds pertaining to the economy – http://spy.appspot.com/find/economy?latest=25
Have you seen any other innovative visualizations of the economy, its impact on the United States or the World or any other interesting interactive visualizations related to this topic?
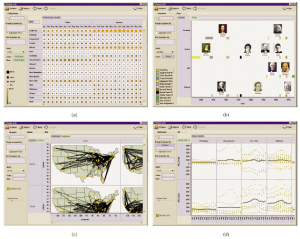
IEEE Infovis 2008 overview – 1


I am attending the IEEE VisWeek 2008 in Columbus, OH right now. Its a wonderful conference, the first part of which is focusing on information visualization. Here are some of my thoughts about some of the wonderful talks that I’ve heard so far. I wont be posting as regularly as Robert Kosara‘s almost live miniblog on http://eagereyes.org/ or Carlos Scheidegger‘s blog at http://carlosscheidegger.wordpress.com/ but I will definitely keep posting my thoughts on the papers and other events.
Rolling the Dice: Multidimensional Visual Exploration using Scatterplot Matrix Navigation
Niklas Elmqvist, Pierre Dragicevic, Jean-Daniel Fekete
An interesting way to explorer multidimensional data with scatterplots. The video of the system highlights the strengths of scatterplots. They use the metaphor of rolling a dice, since as they use
animation as they transform from one visualization to the next. I wonder whether at some
point the animation and transitions distract the user from the exploration process. In their paper,
they say that “User evaluation is difficult for such broad tasks as visual exploration” but they plan
to evaluate their techniques further.
A Framework of Interaction Costs in Information Visualization
Heidi Lam
A great and much needed paper discussing the costs of incorporating interaction into information
visualization. The work was inspired by these wonderful books by D. A. Norman.
D.A. Norman. The Design of Everyday Things. Doubleday/Currency, 1990.
D.A. Norman. Things that Make Us Smart. Basic Books, 1993.
D.A. Norman. The Design of Future Things. Basic Books, 2007.
I have read the first two and shall definitely read the next book now. I would strongly encourage students to read these books as they serve as a good resource for thinking about visualization design. Heidi has adapted Norman’s Seven Stages of Action into the analysis. She found that one needs to take into account interaction costs when evaluating any kind of visualization. I applaud such effort and look forward to more research taking interaction into account during evaluation.
EMDialog: Bringing Information Visualization into the Museum
Uta Hinrichs, Holly Schmidt, Sheelagh Carpendale
An extremely interesting talk about an information visualization installation being placed in a museum.
The presentation was very unique and clearly stated their experiences with the installation. The
positive and, more importantly, negative feedback they received from the visitors was clearly specified, which was great.
Graphical Histories for Visualization: Supporting Analysis, Communication, and Evaluation
Jeffrey Heer, Jock D. Mackinlay, Chris Stolte, Maneesh Agrawala
A great talk by Jeff who discussed the implementation of seemingly simple ‘histories’ feature
for Tableau. The idea of ‘undo-as delete’ as well as ‘the undo operation is performed 12 times more
than redo operations” was an interesting observation which seems believable to me.
Who Votes for What? A Visual Query Language for Opinion Data
Geoffrey M. Draper, Richard F. Riesenfeld
Interesting talk and demo. The paper is getting a lot of press lately [here and here].
It might be interesting to explore non-radial layouts and explore the benefits of different layouts.
The discussion about color design that followed the talk will definitely benefit their system. I look forward to some visualizations from the US 2008 presidential elections using their system.
Visgets: Coordinated Visualizations for Web-based Information Exploration and Discovery
Marian Dörk, Sheelagh Carpendale, Christopher Collins, Carey Williamson
This was an interesting talk about coordinating visualizations for exploration of real-world data.
Particularly since in the last post on visualization in politics, I mentioned Sheelagh Carpendale’s work for visualizing data for exploration and discovery and yesterday I had a chance to attend the exact same talk.
Vispedia: Interactive Visual Exploration of Wikipedia Data via Search-Based Integration
Bryan Chan, Leslie Wu, Justin Talbot, Mike Cammarano, Pat Hanrahan
This talk was great at exploring knowledge within wikipedia. The aim was to obtain a database
from DBPedia (http://dbpedia.org/About) into their system and allow users to make fast
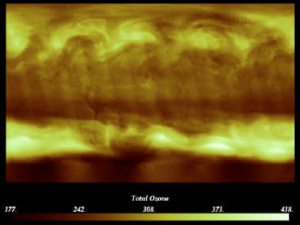
geographic visualizations. Bryan demonstrated how the capitals of the countries in the world
could be visualized and then how the visualization could be tweaked with parameters such as population of the city and so on. You can play around with their tools at
http://graphics.stanford.edu/projects/vispedia/ or http://vispedia.stanford.edu/
The Word Tree, an Interactive Visual Concordance
Martin Wattenberg, Fernanda B. Viégas
Martin gave an excellent talk on the use of Word Trees. The visualization technique can be accessed at IBM Many Eyes [http://services.alphaworks.ibm.com/manyeyes/page/Word_Tree.html].
He showed some excellent examples that provide insight into word relationships in various literary
texts. In particular I enjoyed the “I am married but..” example which was based on a collection
of advertisements.
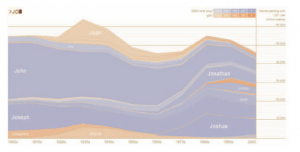
Stacked Graphs – Geometry & Aesthetics
Lee Byron, Martin Wattenberg
Ben schneiderman – vertical vs horizontal stacked graphs – vertical works better according to him. He
used listening history first which was done horizontally. Labelling worked better with the vertical
graph as there was more real estate around it. NYtimes was only 2 yrs whereas online version was 21 yrs. Some relevant links:
Web-based version of the NYTimes piece: http://www.nytimes.com/interactive/2008/02/23/movies/20080223_REVENUE_GRAPHIC.html
http://services.alphaworks.ibm.com/manyeyes/page/Stack_Graph_for_Categories.html
http://www.leebyron.com/else/streamgraph/
Visualizing the box office: http://www.leebyron.com/what/boxoffice/
Visualizing listening preferences on Last.fm: http://www.leebyron.com/what/lastfm/
Cerebral: Visualizing Multiple Experimental Conditions on a Graph with Biological Context
Aaron Barsky, Tamara Munzner, Jennifer Gardy, Robert Kincaid
Presenting results and innovations with visualization researchers working with biologists. Early
on he said something that is very true, since I’ve work with application domain experts.
He basically said that collaborators like any kind of visualizations and think you are awesome
for having created that. You on the other hand know that they are just previously published research
which might not get you a ‘best paper’ award at a conference 🙂 He presented some real issues about the divide between the scientists and visualization researchers.
The Shaping of Information by Visual Metaphors
Caroline Ziemkiewicz, Robert Kosara
Evaluating the visualization metaphors and their effect on our understanding of visualizations. The idea and discussions leading up to the results were very convincing. I was a bit dissapointed to see that in the results, they found that people were able to perform well even with incompatible metaphors. I wonder if that had anything to do with the fact that non-visualization users (i mean researchers mostly) are not very familiar with the visualization techniques such as treemaps. I keenly look forward
to the future work from the authors.
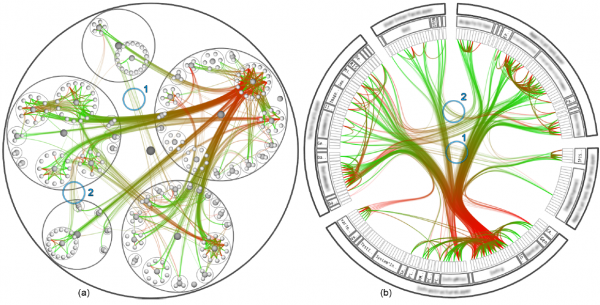
Geometry-Based Edge Clustering for Graph Visualization
WeiWei Cui, Hong Zhou, Huamin Qu, Pak Chung Wong, Xiaoming Li
I liked the idea of the paper but I do agree with some of the questions that were asked after the talk about how hard is it to interact with the graph, how easy it was to implement the technique etc. I strongly encourage WeiWei to upload some of the code for us to try out their techniques.
More thoughts about the terrific infovis keynote and other sessions coming soon!!
IEEE Visualization 2007 conference review – part 1
Hello all,
The IEEE Visualization 2007 conference concluded in Sacramento, CA on November 1, 2007. I had mentioned some of my favorite papers when the papers list was out. But, I found some more papers, panels and talks to be even more interesting than I had thought.
I guess its going to be a big post, since I’m going to go through all that I liked in the conference (and maybe some things that I didnt like).
- The InfoVis keynote by Matt Ericson of New York Times was very well done. His group faces the daily challenge of communicating ideas using a visual representation of facts, stories and data. Unlike visualization researchers who assume that their audience will take the effort to understand their complex visualization, they at NYTimes cannot assume any such thing and have to develop ‘informational graphics’ for a reader. Fernanda Viégas from IBM Research has summarized some of the key points of the talk and also has managed to get access to some of his images. Here’s the link on infosthetics – http://infosthetics.com/archives/2007/10/infovis_keynote_matthew_ericson.html
- The InfoVis session on Infovis for the Masses was one of my favorite sessions – The session chair was Ben Shneiderman who does such a fantastic job every time he talks. I attending his paper presentation last year and this year, as session chair, he setup the talks so well. The session contained a paper on Many Eyes (which as the readers of this blog may have observed, I really like :)) Fernanda Viégas, Martin Wattenberg and Frank van Hamm gave an excellent presentation. The second impressive talk of the session was on Scented Widgets by Wes Willett at UC Berkeley. Jock Mackinlay then showed a heavily demo-focussed presentation of the Show Me: Automatic Presentation for Visual Analysis paper. He was demoing the Tableau software from Tableau, which is the company he is now working for.
- The Evaluation session was another fabulous session that had a great collection of superb papers. I liked each and every one of them.
- Jeff Heer’s talk on Animated Transitions in Statistical Data Graphics discussed some work he did with George Robertson at Microsoft Research. He discussed some of the limitations of using animations that are extremely well documented by Barbara Tversky‘s paper – Animation: Can it facilitate? Visualizing any kind of change is extremely hard and he sort of weaved his way around the problems of animations and presented some great work. The user study was well conducted and I think its essential to be able to really stand up and defend your results in a quality conference such as InfoVis (pretty pictures obviously help) 🙂 Some results obtained by them were not in favor of their techniques, but thats a result too and it was interesting to see that. In case you didnt already know, Jeff Heer is also the author of the popularly used Prefuse infovis toolkit.
- This year was the second year they had the Art show at Vis and they showcased some really beautiful and insightful visualization.
- This year the conference was also augmented by some excellent workshops on Knowledge-assisted visualization and VisSec – visualization for computer security. Smaller more focused workshops are an excellent venue for researchers to publish papers that might not get accepted due to the size of the idea or due to the fact that they’re too specialized for Infovis/Vis. The downside is that sometimes the ideas though great might not as polished and get accepted due to the low submission numbers at the workshop. I still give such workshops a big thumbs up and hope we see more of them.
There were some excellent tutorials at the conference this year. Some of the ones that I attended and my thoughts on the same
- Visual Medicine tutorial – The morning session on Introduction to visual medicine though well presented is really something that does not need to be presented for the second part of the day on Advanced Visual Medicine to be understood. The advanced session was amazing and presented some phenomenal work that researchers were doing to use the power of medicine in improving doctors treat patients better in DT MRI, reconstructive surgery, perfusion data and multiresolution volume rendering.
- Illustrative Display and Interaction in Visualization – This tutorial has become a mainstay of the conference and has included a great group of speakers over the years. The images produced present a compelling body of excellent work in the field of illustrative visualization. I have attended it in the past and have seen parts of it this time. The only minor complaint that I have is that the work is of limited use unless its being use in an application domain such as preoperative planning systems and other real world applications. In the European version of their tutorial at Eurographics 2006, they had a few other speakers who covered preoperative planning using such techniques.
- GeoVisualization with Google Earth and GIS – This tutorial clearly conveyed that Google earth has a lot of wonderful applications than just flying around the world. The ability to add layers and interact with regions of interest was simply superb. Some datasets and files that they used during their tutorial can be downloaded here.
I realize now that I have many more thoughts that I’d like to add as regards the conference and so I shall add them in part 2. Coming soon!! Well you know how often I update this blog, so ….. soonish 🙂
