Visualizing disease incidence in the context of socioeconomic factors
Disease incidence is usually connected to biological factors such as genetics, eating habits, exercise and so on. But are there are other socioeconomic factors that influence disease incidence as well? This TED talk from Bill Davenhall inspired us to explore socioeconomic factors that may influence disease incidence.
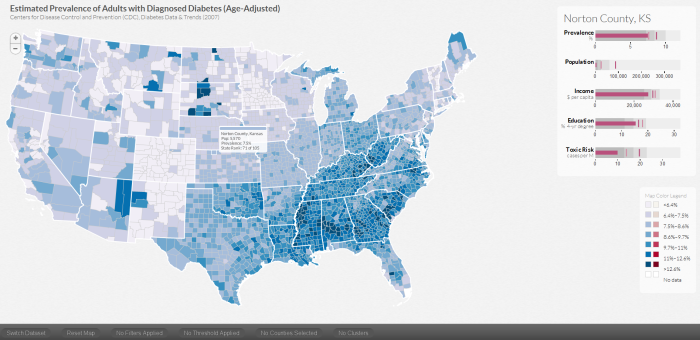
To explore the connections of socioeconomic factors such as education levels, regional population, income level of the area where you live and the air pollution in terms of toxic levels, we developed a visualization tool called DiseaseTrends. DiseaseTrends allows the exploration of possible correlations between those socioeconomic factors with diabetes prevalence and cancer incidence rates across counties throughout the United States. A user can interactively explore these factors at a county, regional (user defined cluster of counties), state or national level.
When a user explicitly selects a county, we display 5 similar counties based on their socioeconomic factors. The motivation behind this feature is to allow users to identify similar counties that may have varying disease incidence rates, which may in turn lead to further exploration.
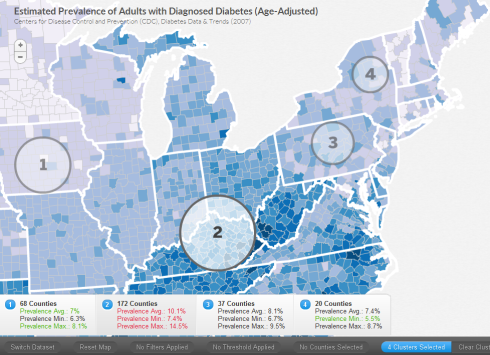
As mentioned above, a user can specify regions manually that cross state boundaries. A user defined circular cluster can be specified using Ctrl on PC, Cmd on Mac – then click and drag. Here the user has specified four regions. The maximum prevalence (in red) and the minimum (in green) across the selected region is highlighted in the panels below.
We use bullet graphs (pdf link) as introduced by Stephen Few to display the quartile distribution of a factor as well as the corresponding state and national average (faint and dark vertical bars).
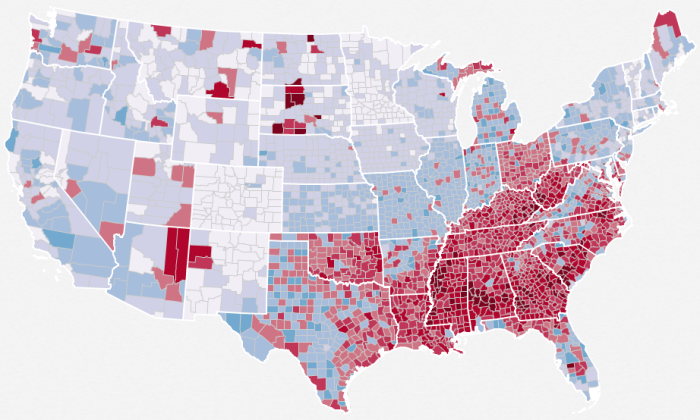
Through this tool, we can easily see the now popular diabetes belt, as shown here
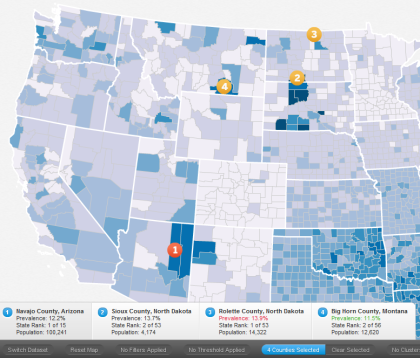
High incidence rates in Native Indian reservations such as Navajo County, Sioux County, Rolette County and Big Horn County too can be seen.
We would like to mention that DiseaseTrends does not imply any causation and can merely hint at possible associations. It is completely up to a researcher in the field of public policy / public health to further investigate the findings.
More details about DiseaseTrends can be found in our paper.


Very informative video and post. Thanks the share.
Sports Visualization Training
October 19, 2012 at 4:30 pm