Visualization in Sports
This article is not about “improving your ability in sports using visualization“. This post is focused on the ubiquity of computer graphics and visualization in sports. As a television viewer, player, coach or just a curious individual, you may have seen some of these visualizations for analyzing a game. It seems more common for coaches to use visual analytic tools to analyze the opposing teams in almost all sports now.
Visualizing American football (NFL)
- Professor Chris Healey from NCSU has an interesting project on visualizing NFL games. The project details can be found at http://www.csc.ncsu.edu/faculty/healey/NFL_viz/.Here is a screenshot of a small section of the visualization of the entire SuperBowl 2009 game between Arizona and Pittsburgh.

- The NYTimes vis lab has an interesting visualization titled – Rushing points per game – http://vizlab.nytimes.com/visualizations/rushing-points-per-game-nfl-teams-2
- On Many Eyes you can see that common users have generated visualizations of various aspects of football
- Visualizing Fantasy Football teams – This paper by Pearlman et al. discussed ways to visualize diversity in a fantasy team and is an interesting read. Jason Pearlman, Penny Rheingans, Marie des Jardins, “Visualizing Diversity and Depth over a Set of Objects,” IEEE Computer Graphics and Applications, vol. 27, no. 5, pp. 35-45, Sep./Oct. 2007, doi:10.1109/MCG.2007.139
- Ben Fry‘s post linking the intelligence of a football player with their position on the field. His post talks about how teams have started using Wonderlic test while scouting players and that their performance on that test becomes one of the factors that determines the position they play on the field. Its quite an interesting read supported ofcourse by visual representations. More at http://benfry.com/writing/archives/147
Visualizing Baseball (MLB)
- Ben Fry strikes(?) again!! His entertaining interactive ‘Salary vs Performance‘ sketch implemented in Processing provides interesting insights into whether the most expensive team is actually performing the best (or NOT as in the case of the New York Yankees :)) Visit http://benfry.com/salaryper/ to play with the sketch and find out how your favorite team is doing.

- A very interesting blogpost on ‘Visualizing Tim Wakefield’s knuckleball‘. A statisticians view on analyzing and visualizing baseball pitches and baseball data in general. Has some good links for baseball related data.
- Josh Kalk’s amazing tool that lets you create your own baseball graph by using a simple interface – http://baseball.bornbybits.com/php/combined_tool.php. For example, playing around with it I found that Alex Rodriguez hits most home runs on a fastball as compared to a slider or a splitter.
- Can parallel coordinates be far behind? Parallel coordinates for visualizing baseball statistics – http://www.matthewtavares.com/baseball_report/
- Wow! A Baseball visualization tool – Visual io is a visualization company that produces tools for allowing visual analysis of corporate data. They used to have a baseball visualization tool that has been taken down. It was really cool and more details can be found at http://simplecomplexity.net/2008/11/26/visual-ios-baseball-visualization-tool/
- An interesting article by Dan Fox called “Schrodinger’s Bat” on visualizing baseball pitches. Clearly the title is a play of words on Schrodingers Cat 🙂 Here’s a visualization of DiceK‘s three pitch types.

Visualizing Basketball (NBA & WNBA)
- Very interesting post on what combinations of players works best and what styles the teams play – Visualizing the WNBA’s top player combinations
- Links to an excellent article about NBA playing style spectrum.The spectrum of most of the famous basketball players can be found at http://gmapuploader.com/iframe/OcGKRzNj4B. Zoom in to explore it closely.
- David Ng’s final project on Professional Basketball Player Performance Trends from Hanspeter Pfister’s class at Harvard (http://www.seas.harvard.edu/courses/cs171/)
- ESPN’s Game Flow – Line graph to show the progression of the game
- A very amusing visualization correlating Return of Investment on their players. The idea is similar to Ben Fry’s ‘salary vs performance’ sketch, but the visualization here is completely different.
- An awesome visualization of all the shots from the NBA 2007-08 season. Check out their processing sketch at http://jasonrbailey.com/jason/courtvis/. Clearly, players prefer to hit three pointers from the corners than anywhere else.

- More visualization that look like treemaps from – Road to the NBA finals
- Another visualization showing something they call the Player Genome . They visualize each player’s stats as a color coded line. The entire visualization does look sort of like a genome 🙂
Visualizing Cricket
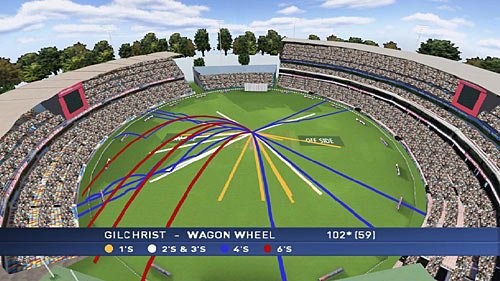
- -Infographics is widely used in telecasts – Bowling overview, batting overview (wagon wheel) to show which parts of a ground is a particular player hitting to in that innning. A snapshot of a wagon wheel (as it is called) is shown here (Image credits: cricinfo)

- The value of graphical presentation of data: An example from cricket – http://www.mansw.nsw.edu.au/members/reflections/vol23no4skinner.htm
Golf swing visualization
- Urtasun et al. published a paper for 3D tracing of the golf swing. Here is the citation and the link to the paper: Raquel Urtasun , David J. Fleet , Pascal Fua, Monocular 3-D Tracking of the Golf Swing , Proceedings of the 2005 IEEE Computer Society Conference on Computer Vision and Pattern Recognition (CVPR’05) – Volume 2, p.932-938, June 20-26, 2005. Here is a snapshot from their paper.

- Naturally, there would be a company selling a product for such sort of a thing. Flightscope, the company that tracks a tennis ball for debatable calls during a match, uses 3D Doppler tracking for tracking your golf swing –
I am sure you have seen visualization and infographics being widely used in your favorite sports. Please feel free to add a link or even mention it in the comments section.
[…] Visualization in Sports « Visualization Blog. Share and Enjoy: […]
Visualization in Sports | VizWorld.com
May 8, 2009 at 2:00 pm
How about marathon ‘visualization’ – it’s fairly crude but with the addition of ‘splits’ data and year on year performances could be more useful…
http://racereplay.net/
http://conceptdev.blogspot.com/2009/04/silverlight-virtualearth-map-control_06.html
CraigD
May 8, 2009 at 11:01 pm
[…] Visualization in Sports « Visualization Blog […]
foremost problem Blog » Advances in the Theory and Practice of Graph Drawing
May 9, 2009 at 8:39 am
[…] Visualization in Sports " Visualization Blog May 9th, 2009 Goto comments Leave a comment With all of the big $$$ at stake, it's not surprising that there's a whole world of sports visualization going on out there, helping coaches and players get a better handle on how best to play the game. I especially like the Processing sketch of the positions of basketball players' shot attempts.https://visualizeit.wordpress.com/2009/05/07/visualization-in-sports/ […]
Visualization in Sports " Visualization Blog | File Search Engine Ispey
May 9, 2009 at 6:56 pm
Maybe, you should also consider some interesting things for European sports.
Have a look to some interesting stuff:
* http://tinyurl.com/ooz9ab
* http://tinyurl.com/ctd4cm
Thanks,
d.
Daniele Galiffa
May 11, 2009 at 3:43 am
Hey Daniele,
Thanks for the links. Visualizing football is really interesting and I think there’s a lot more that could be done with it. If you know of any data sources where detailed match information (play-by-play) can be found, please let me know. I’d love to try visualizing it.
visualizeit
May 26, 2009 at 11:28 am
[…] Jason R. Bailey built this Processing visualization that tracks the position of all the shots from the NBA’s 2007-2008 season. [via Visualize It] […]
Visualization: Position of all NBA shots, ‘07-’08 « Clandestine Activities
May 11, 2009 at 2:10 pm
[…] Visualization in Sports « Visualization Blog. […]
Cinder Inc. » Visualization in Sports
May 12, 2009 at 12:40 pm
[…] (Via.) […]
This Is What Football Looks Like When You Take The Red Pill | MOUTHPIECE Blog // A Chicago-Addled Sports Blog
May 14, 2009 at 2:48 pm
[…] media with their data obsessed fans is pushing the boundaries on data visualization, read up on these great blogs to learn […]
adaptive path » blog » Brian Cronin » Signposts for the Week Ending May 15
May 16, 2009 at 11:44 am
[…] lot of positive attention recently including a mention on Boing Boing Gadgets. Also got a mention onVisualization Blog in an article about visualization in sports. Always great to get feedback, especially when it is […]
Dynamic Research » Blog Archive » Basketball Visualization Gets Love From Boing Boing
May 25, 2009 at 2:24 pm
Hey Jason,
The basketball visualization sketch on your website received the maximum number of clicks for this post on ‘visualization in sports’. Thanks for the informative sketch.
visualizeit
May 26, 2009 at 11:30 am
[…] in Sports In Uncategorized on May 30, 2009 at 9:14 am A digest article about different ways to visualize sports stats and interactions. ▶ Comment /* 0) { […]
Visualization in Sports « Information Design at Penn
May 30, 2009 at 10:14 am
[…] Visualization in Sports « Visualization BlogGreat collection of sports-themed visualizations. […]
» EverydayUX morsels (July 2nd – July 5th) | EverydayUX: Everyday User Experience by alex rainert
July 5, 2009 at 7:02 pm
[…] https://visualizeit.wordpress.com/2009/05/07/visualization-in-sports/ […]
Thesis 2009 » Another cool page of links….
August 2, 2009 at 2:55 am
[…] https://visualizeit.wordpress.com/2009/05/07/visualization-in-sports/ This entry was posted on Saturday, August 1st, 2009 at 11:55 pm and is filed under Context and Domains (Research), General. You can follow any responses to this entry through the RSS 2.0 feed. You can leave a response, or trackback from your own site. […]
Blogatron » Another cool page of links….
September 3, 2009 at 7:46 pm
This was a great read. As an avid sports fan (and stats junkie) I especially liked Josh Kalk’s PITCHf/x tool and will definetely be adding it (and your website) to my rss reader. Thanks for the great post!
Mike
September 25, 2009 at 7:35 pm
If you’re interested in baseball infographics, also check out http://visualbaseball.wordpress.com
Kevin
October 20, 2009 at 7:10 pm
Great design first thing… Second thing the prespective at which you see the sport is quite neutral quite in my words wikipedia style. This is a welcome change from people who are either racist or support a particular agenda.!
Victoria
December 22, 2009 at 6:38 am
Hey, I just wanted to say what a good website. I certainly enjoyed it and found it entertaining reading. Excited to read your next post!
premier league goals
January 20, 2010 at 8:05 am
[…] Visualization in Sports (7.5.2009):This post is focused on the ubiquity of computer graphics and visualization in sports. As a television viewer, player, coach or just a curious individual, you may have seen some of these visualizations for analyzing a game. It seems more common for coaches to use visual analytic tools to analyze the opposing teams in almost all sports now. […]
Fußball Statistiken: Tracking der Spieler per Kamera und per Hand | Datenjournalist
June 28, 2010 at 9:22 am
[…] https://visualizeit.wordpress.com/2009/05/07/visualization-in-sports/ […]
Data Visualization | My Blog
March 26, 2012 at 9:41 pm
[…] Visualization in Sports — roundup of the use of computer graphics and visualization in sports. Sports is competitive, lucrative, and quite fast-paced. I love to see sport and business learning from each other. (via tomc on delicious) tags: book related, crowdsourcing, journalism, mobile, visualization $(".button.print a").click(function () { jQuery.cookie('thePostID', "36160" , {expires: 1, path: '/' }); }); […]
Four short links: 8 May 2009 - O'Reilly Radar
August 3, 2012 at 2:32 pm